
Published on: 01 Jun , 2026
How to Measure Step-by-Step Guide Performance
On this page
The instinct when asked "is this guide working?" is to look at page views. Page views tell you a guide was opened — nothing more. A guide with 500 views could mean 500 customers resolved their problem and never filed a ticket. It could also mean 500 customers tried the guide, failed at step 4, and submitted a ticket anyway. Without completion data and post-guide ticket rate, the number is ambiguous. And 70–73% of knowledge management initiatives fail to achieve their objectives — the primary reason is lack of measurement to drive continuous improvement (Artiquare). Not lack of content. Lack of the right metrics. This article covers the five metrics that actually tell you whether a step-by-step guide is working, how to run a practical performance audit, and how to track all of it in Trainn.
The 5 Metrics That Tell You Whether a Step-by-Step Guide Is Working
To measure step-by-step guide performance, track five metrics: completion rate, per-step drop-off, post-guide ticket rate, per-customer account engagement, and guide-to-outcome correlation. Page views confirm the guide was opened — not that it worked.
| Metric | What it measures | What to aim for |
|---|---|---|
| Completion rate | % of customers who finish the guide after starting | 60–70%+. Below 40% signals a structural problem |
| Per-step drop-off | The exact step where customers stop | Find the single highest drop-off step — fix that step first |
| Post-guide ticket rate | % of guide viewers who submitted a support ticket on the same topic within 48 hours | Low = guide resolved the question. High = guide failed |
| Account engagement | Which customer accounts are using guides — and which aren't | Zero-engagement accounts are high-touch support risks |
| Guide-to-outcome correlation | Do guide completers show higher adoption, lower churn, higher expansion? | Customers completing structured education are 56% less likely to churn (Disco) |
The rest of this article explains how to gather and use each layer.
The Three-Layer Framework for Measuring Guide Performance
Guide performance doesn't collapse into a single number. A guide can have strong view counts but a broken completion rate. It can have strong completion rates but still generate tickets. And a guide that deflects tickets may not be provably connected to retention until you join the data. Each layer answers a different question — and you need all three to build a complete picture.
Layer 1: Engagement Metrics — What Customers Are Doing
Engagement metrics tell you how customers interact with a guide. They are the diagnostic layer — they show where a guide is failing, even before you check whether it's reducing tickets.
Completion rate is the most important engagement metric. It measures what percentage of customers who started a guide reached the final step. Best-in-class guides hit 60–70% or above. A guide below 40% has a structural problem — it may be too long, cover more than one task, or have a specific step where customers lose confidence. You can't tell which until you look at per-step data.
Per-step drop-off is the most actionable metric a guide can produce. It tells you exactly which step customers abandon. A guide with a 70% drop-off at step 5 of 12 is not a bad guide — it's a guide with one bad step. Rewrite step 5, re-capture the screenshot, and the completion rate recovers. Without step-level data, teams rewrite the entire guide to fix a problem that one improved step could have solved.
Time per step surfaces steps where customers are spending significantly longer than the average. A step that takes three times longer than expected signals an unclear instruction, a screenshot that doesn't match what the customer sees, or an action that requires multiple attempts.
Return visits — customers who view the same guide more than once — signal a guide that didn't resolve the question on first read. A guide customers bookmark and come back to repeatedly is not being marked as a success. It's being used as a reference because the process wasn't clear enough to follow once.
A note on tooling: engagement metrics at the step level require a guide tool that tracks step-level interactions. Tools that present guides as scrollable documents — or as static PDFs — cannot produce per-step data. If your guide tool only shows total views, you are limited to Layer 1 surface metrics.
Layer 2: Outcome Metrics — Whether the Guide Actually Worked
Outcome metrics answer the question your manager is actually asking: is this guide reducing tickets and helping customers succeed? Engagement tells you what customers did. Outcome tells you what happened as a result.
Post-guide ticket rate is the most direct test of guide effectiveness for ticket deflection. For each guide, look at the proportion of viewers who submitted a support ticket on the same topic within 48 hours of viewing. A high post-guide ticket rate means the guide failed — the customer found it, tried it, and still needed help. That is a worse experience than skipping the guide entirely, because it adds a failed self-service attempt before the customer reaches a support agent.
Deflection rate by guide measures ticket volume change on a specific topic before and after the guide was published. The delta is the deflection rate. A guide on "How to connect your first integration" that preceded a 40% drop in integration-related tickets is demonstrably working. A guide that preceded no change isn't.
Search-to-guide conversion applies to your knowledge base: what percentage of customers who searched a term found and opened a relevant guide? A low rate on a key topic means either the guide doesn't exist or the guide title doesn't match how customers search. Both are fixable once measured.
Self-service resolution rate is the percentage of customers who accessed the knowledge base or in-app tutorials widget and resolved their issue without submitting a ticket. Best-in-class B2B SaaS knowledge bases achieve 40–60% self-service resolution (Corebee, 2026).
Outcome diagnostic — what low readings signal:
| Metric reading | What it signals | What to fix |
|---|---|---|
| High post-guide ticket rate | Guide is failing at resolution | Rewrite failing steps; verify screenshots match current product UI |
| Low deflection rate | Guide not reducing ticket volume | Check findability; check in-app widget placement |
| Low search-to-guide conversion | Customers can't find the right guide | Rewrite guide title in customer language; add search synonyms |
| Low self-service resolution | Customers are abandoning self-service | Review guide completeness and in-app delivery location |
Layer 3: Business Impact Metrics — ROI for Leadership
Business impact metrics connect guide completion to the outcomes that justify investment — product adoption, customer retention, and support cost reduction. This is the layer that moves the conversation from "how many guides do we have" to "what do those guides produce."
Guide-to-adoption correlation asks: do customers who complete the guide for Feature X show higher Feature X usage than customers who don't? This requires joining guide completion data with product analytics — but even a one-time quarterly analysis produces evidence that guides drive adoption rather than just documenting it.
Guide-to-retention correlation asks whether accounts with high guide engagement churn less. Customers who complete structured education are 56% less likely to churn (Disco), and organisations implementing formal customer education see a 22% increase in product retention (Intellum). Measuring this at the guide level — not just the programme level — turns individual guide completion into a retention signal CS managers can act on.
Support cost saved per guide is the most immediately calculable metric. The average agent-handled support ticket in B2B SaaS costs $18–$35 (LiveChatAI, 2025). A guide that deflects 50 tickets per month saves $900–$1,750/month. Across a library of 50 active guides, the aggregate figure becomes a compelling line in a quarterly business review.
Business impact calculation:
| Input | Where to find it |
|---|---|
| Monthly guide views | Guide analytics dashboard |
| Completion rate | Guide analytics dashboard |
| Post-guide ticket rate | Support platform cross-referenced with guide views |
| Deflected tickets = views × completion rate × (1 − post-guide ticket rate) | Calculated |
| Cost per agent ticket | Support ops data (industry average: $18–$35) |
| Monthly savings = deflected tickets × cost per ticket | Calculated |
Run this calculation once per quarter per high-traffic guide. The result is the business case — not a content metric, but a cost-avoidance figure leadership understands.
The Guide Performance Audit: Six Steps
Before real-time tracking is in place, a structured audit gives teams a starting baseline. Begin with the highest-traffic guides — a completion problem in a guide 800 customers see per month outweighs the same problem in one that 20 customers see.
Step 1: Identify your top 10 guides by view count.
These are the guides where performance problems have the highest customer impact. Start here, not with the full library.
Step 2: Map views against ticket volume per topic.
For each high-traffic guide, compare same-topic support ticket volume over the same period. If the guide has 600 views but tickets on that topic haven't declined, the guide is not deflecting. It's either not resolving the question or not being found by the right customers.
Step 3: Identify per-step drop-off.
In any guide with a low completion rate, pull the step-level abandonment data. The step with the highest drop-off is the priority. Rewrite the description, re-capture the screenshot, and re-measure. This is a targeted fix, not a full rewrite.
Step 4: Track post-guide ticket submissions.
Filter support tickets by topic and cross-reference with guide view timestamps. A significant proportion of same-topic tickets from recent guide viewers means the guide is failing at resolution — not failing to be found.
Step 5: Identify zero-engagement accounts. Which customer accounts have no guide engagement at all? These accounts are fully dependent on human support — higher churn risk and higher support cost per account. Proactive CS outreach for these accounts, or a targeted onboarding push, converts reactive support into self-serve behaviour.
Step 6: Connect completion to CRM data. Join guide completion records with account-level CRM data. Compare feature adoption, renewal rate, and ticket volume between accounts that engaged with guides and accounts that didn't. Even done once, this analysis builds the business case for guide investment in terms leadership responds to.
Getting Started with Trainn: How to Track Guide Performance
The metrics framework above requires a tool that actually provides step-level engagement, account-level visibility, and cross-channel analytics. Here is how to access and use each layer in Trainn.
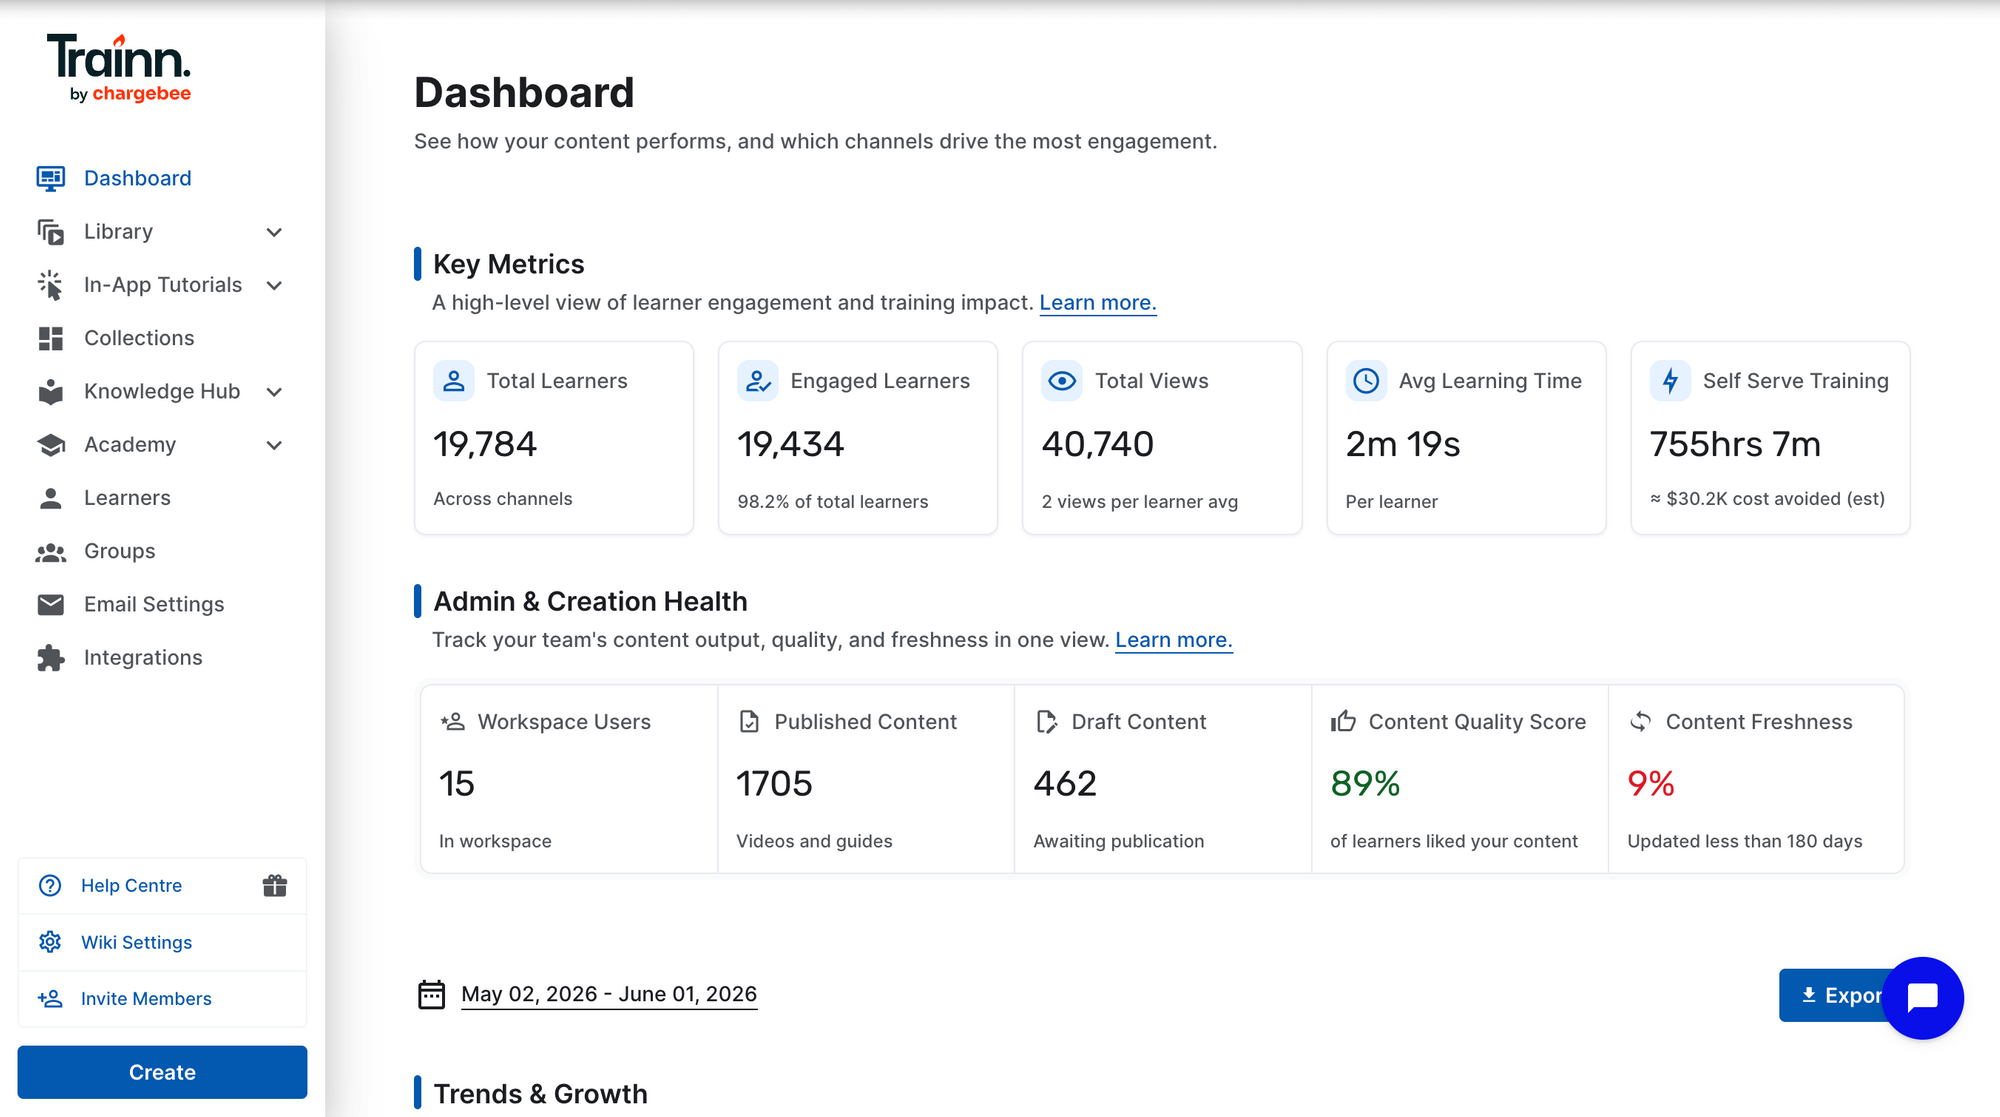
Step 1: Open the Dashboard.
Navigate to the Dashboard in Trainn. The dashboard shows content performance across all delivery surfaces — knowledge base, in-app tutorials, and academy — in a single view.
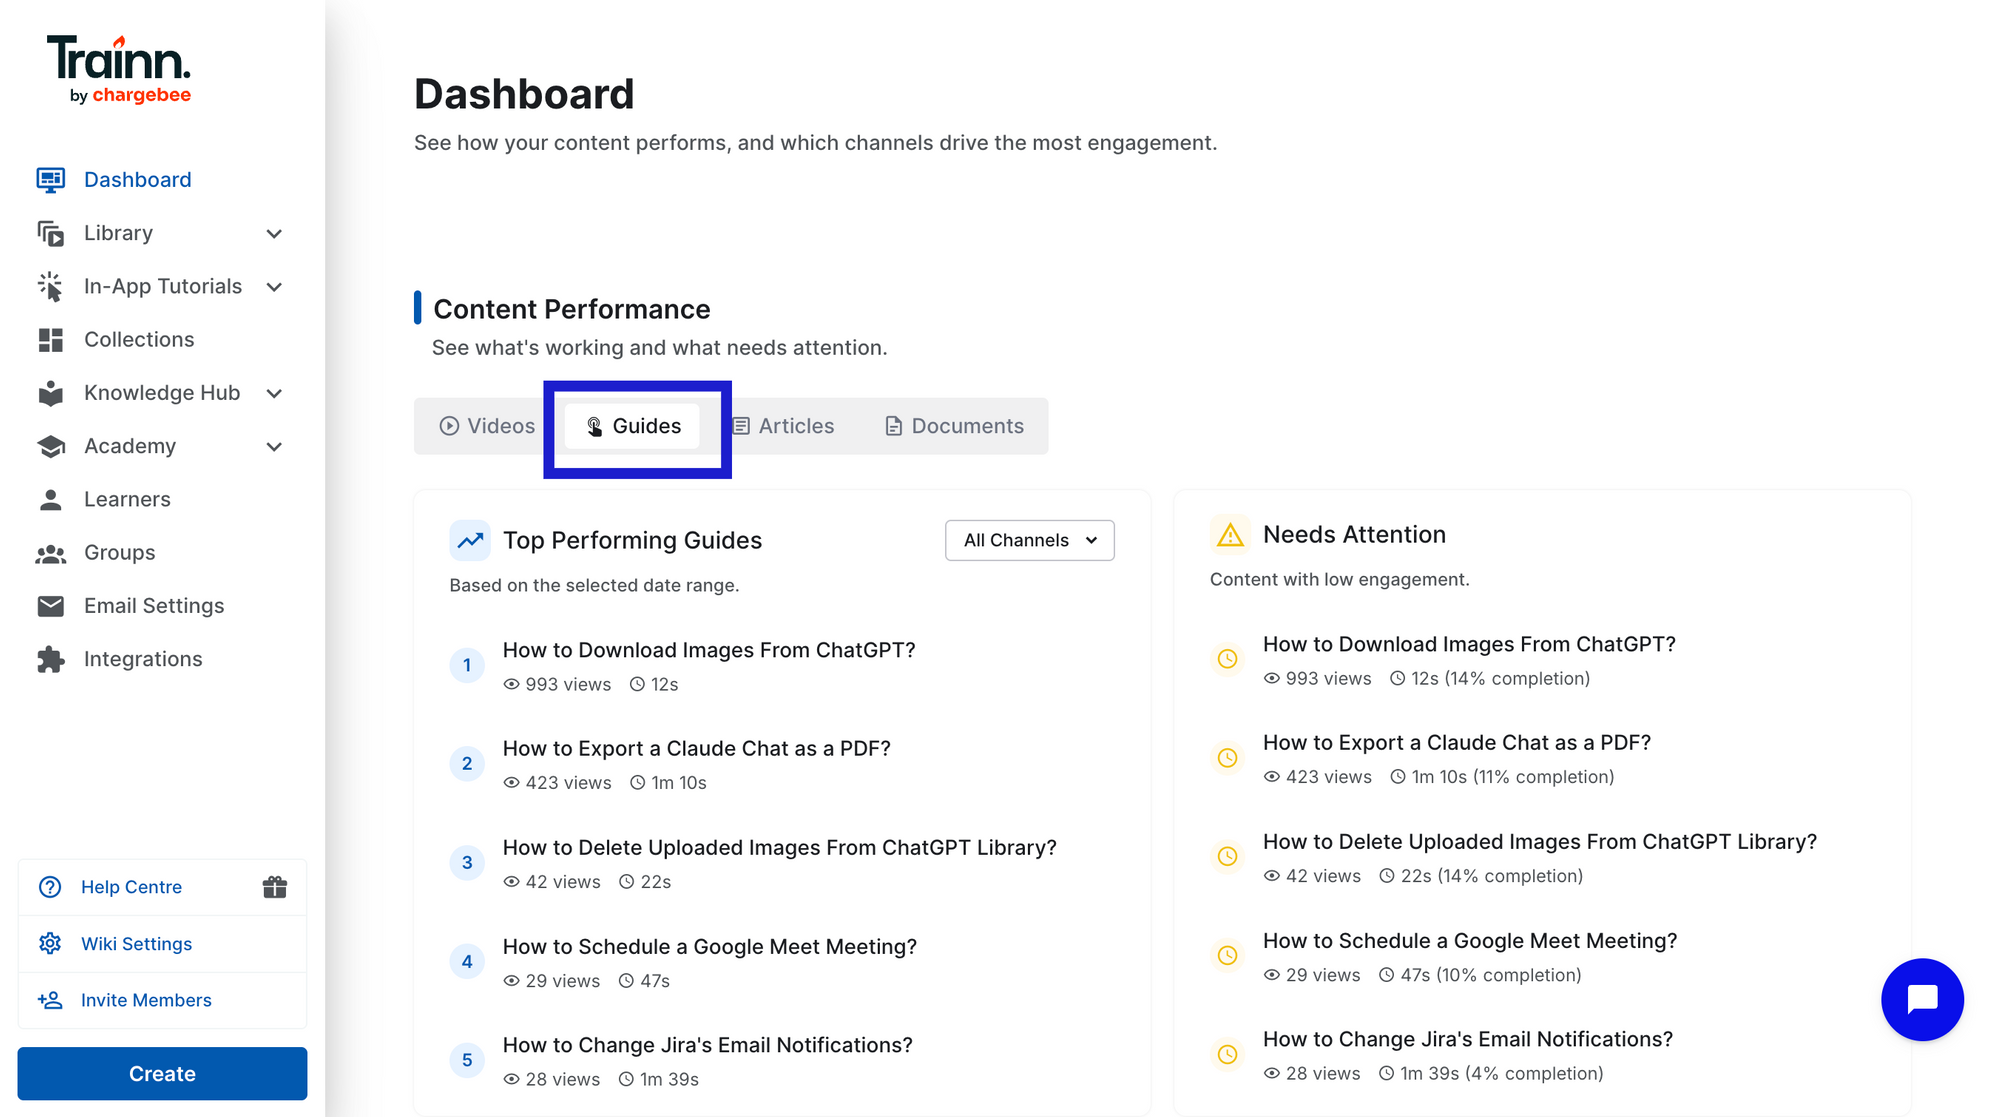
Step 2: Analyze guides performance
Scroll to the Content Performance section and select Guides. This view shows your top-performing guides alongside guides that need attention — a quick way to identify where your library is working and where it isn't. You can also see, in aggregate, which step learners are most commonly dropping off across all guide content.
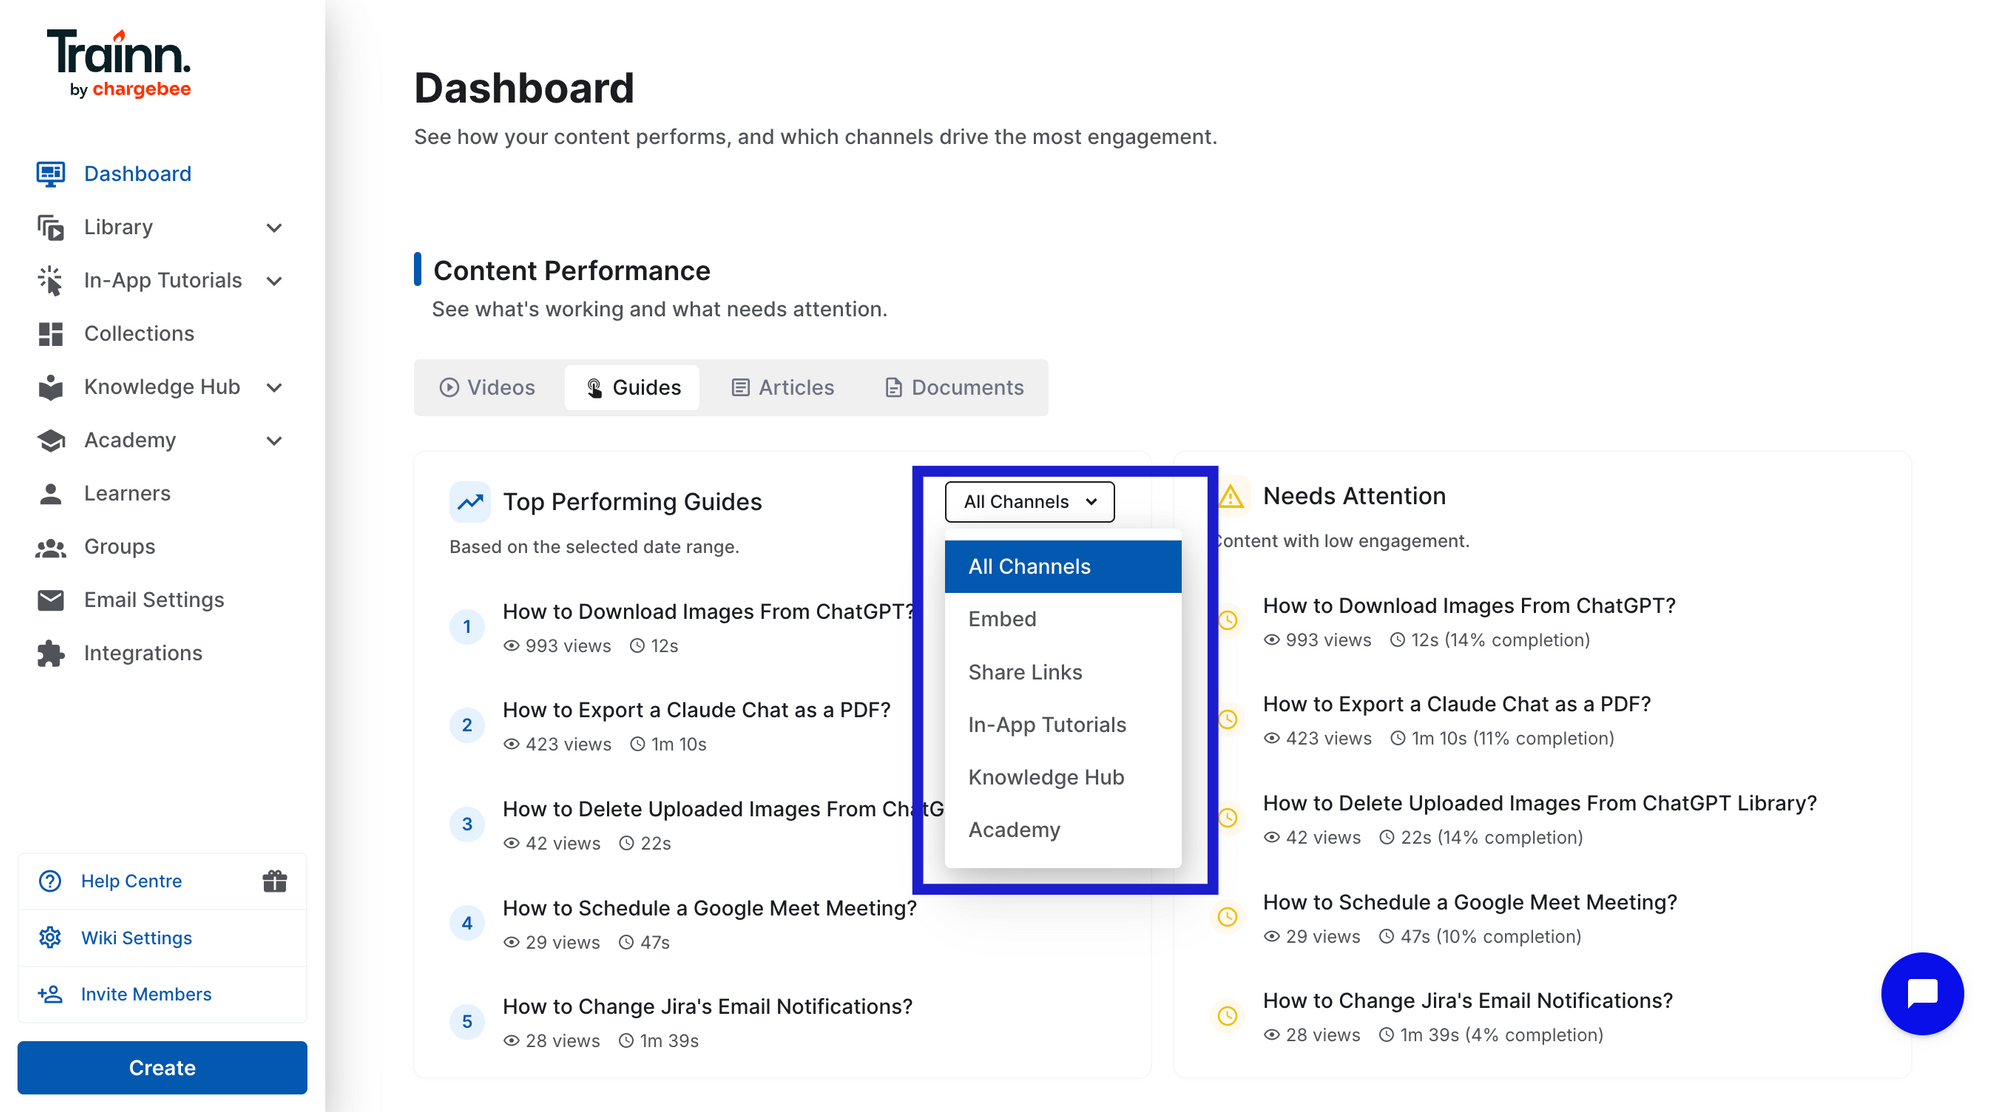
Step 3: Compare performance by delivery channel.
Filter by delivery channel: knowledge base, in-app tutorials, academy. If the same guide shows high knowledge base views but low in-app completion, the in-app widget may not be surfacing the guide at the right screen. Adjusting widget placement at the relevant product screen often lifts in-app completion without changing the guide itself.
Step 5: Cross-reference with support ticket data.
Take your top 10 guides by view count. Match their topics against support ticket volume for the same topics over the same period in your support platform. Guides with high views and no ticket reduction are failing at resolution — prioritise them for the performance audit.
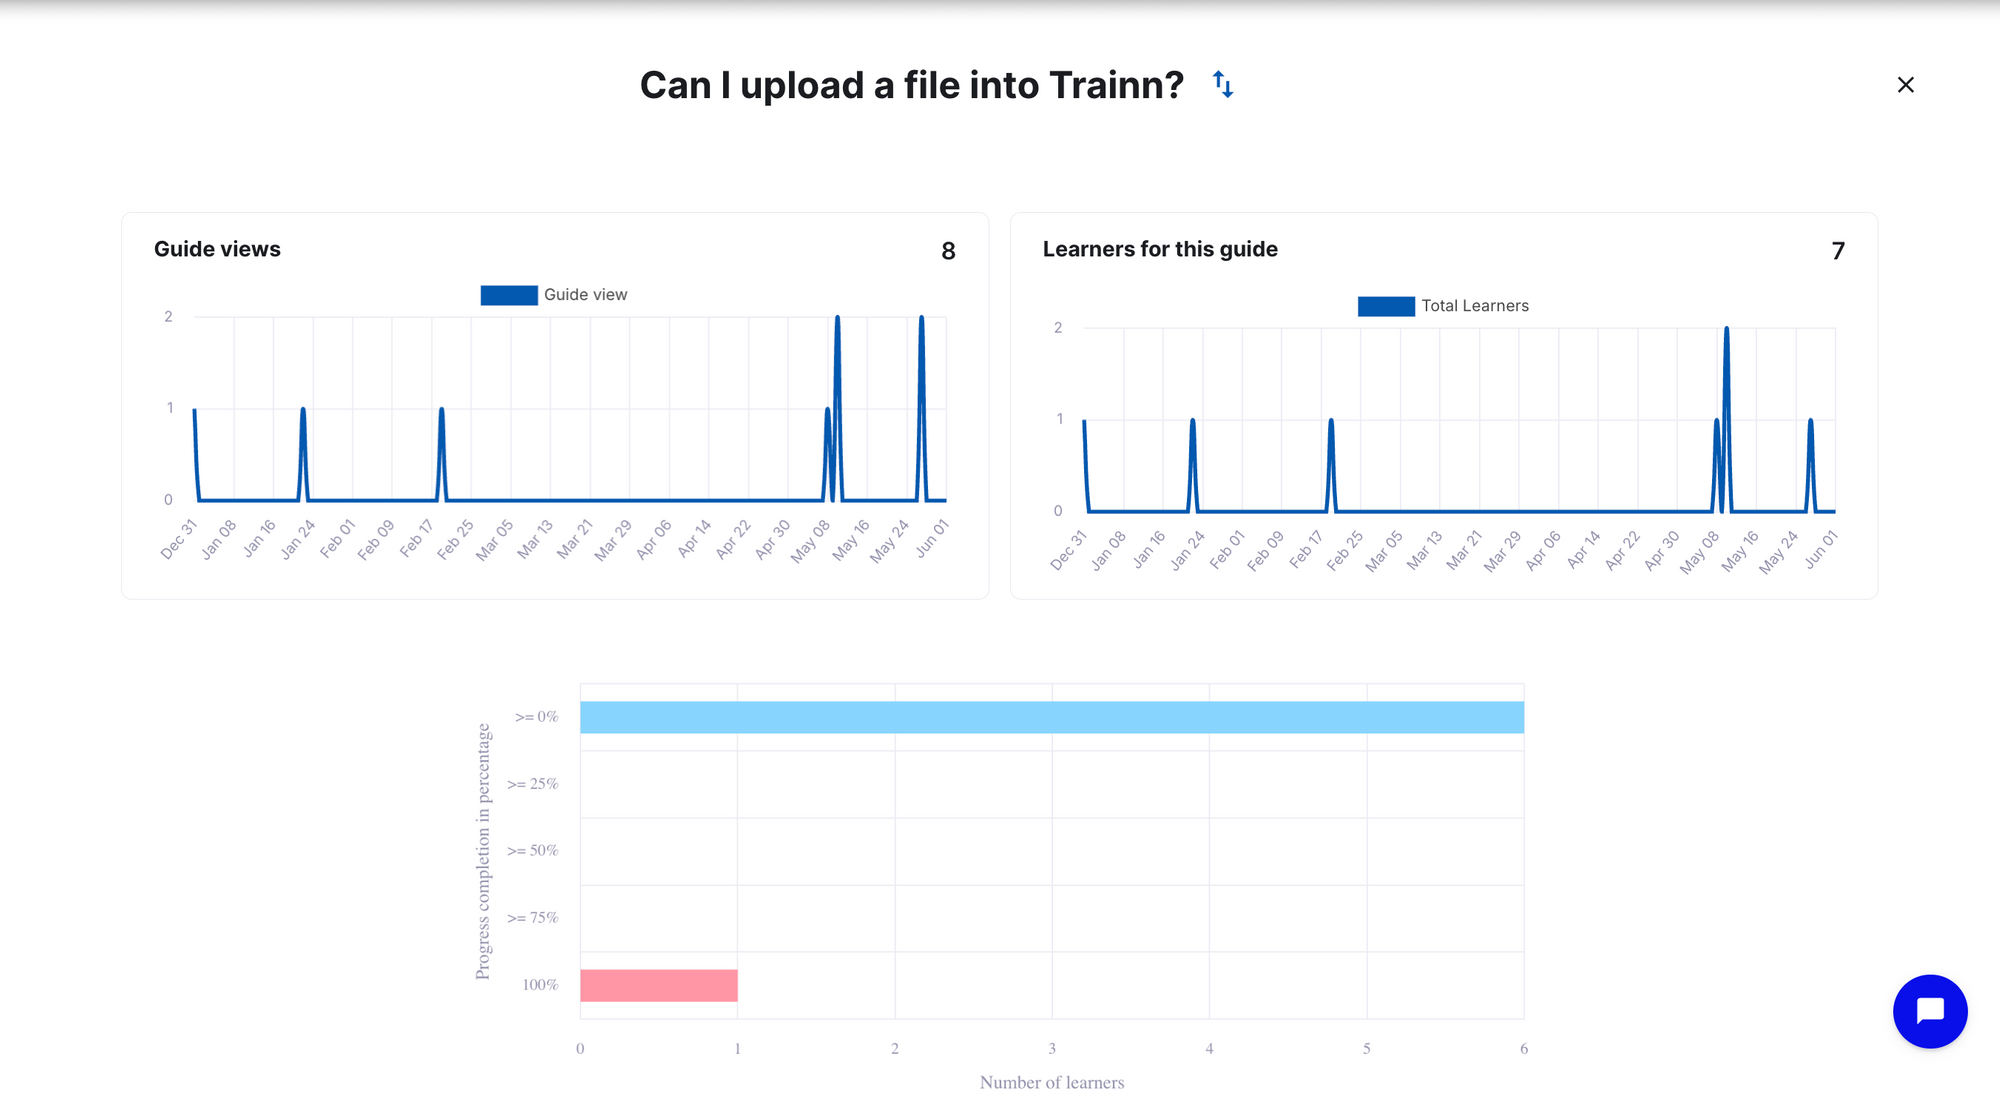
Step 4: Individual guide analytics
Select any guide to view its individual performance data - total views, completion rates. Completion rate is the key number: flag any guide below 40% for immediate investigation.
ServiceNow's technical writing team used per-guide completion data on Trainn to identify which steps were causing customer confusion — and targeted those steps for rewrites without re-recording entire guides. The result: a 50% reduction in per-asset production time and 15–20 guides created or updated per week.
Frequently Asked Questions
How do I know if my step-by-step guides are working? Track five metrics: completion rate (what % of customers finish the guide), per-step drop-off (where they stop), post-guide ticket rate (did they file a ticket after viewing), account engagement (which customer accounts aren't using guides at all), and guide-to-outcome correlation (do completers show higher adoption and lower churn). Page views alone tell you a guide was opened — not whether it succeeded.
What is a good completion rate for a step-by-step guide? Best-in-class step-by-step guides have completion rates of 60–70% or higher. A guide below 40% signals a structural problem — it may be too long, cover more than one task, or have a specific step where the instruction breaks down. Use per-step drop-off data to find the exact failure point rather than rewriting the whole guide.
What is a per-step drop-off and why does it matter? Per-step drop-off is the percentage of customers who abandon a guide at each individual step. It's the most actionable guide metric because it isolates exactly where a guide breaks down — a 70% drop-off at step 5 means step 5 needs a rewrite, not the whole guide. Without step-level data, teams guess which part of a guide is failing and rewrite things that weren't broken.
How do I calculate the ROI of a step-by-step guide? Multiply your monthly deflected tickets (views × completion rate × guide success rate) by the average cost of an agent-handled ticket ($18–$35 in B2B SaaS). A guide deflecting 50 tickets per month saves $900–$1,750/month. For deeper ROI, connect guide completion data to your CRM and compare feature adoption, renewal rate, and support volume between accounts that engaged with guides and accounts that didn't.
Which analytics does a guide tool need to measure performance properly? At minimum: completion rate and per-step drop-off. The full measurement stack adds account-level engagement (which customer accounts are using guides), post-guide ticket rate (cross-referenced with your support platform), and CRM integration for business outcome correlation. Tools that provide only view counts cannot tell you whether a guide worked — only that it was opened.
Next Steps
Page views tell you a guide was opened. Completion rate, per-step drop-off, post-guide ticket rate, account engagement, and guide-to-outcome correlation tell you whether it worked — and exactly what to fix when it doesn't. The audit framework above takes less than a day to run on your top 10 guides and will immediately surface which ones need step-level rewrites and which accounts need proactive CS outreach.
For the delivery infrastructure that makes measurement possible across all customer touchpoints, see Trainn's knowledge base and in-app tutorials.
For more in this series: how to write step-by-step guides that reduce customer support tickets and how often to update step-by-step guides.
Ready to Trainn your customers?
- Create videos & guides
- Setup Knowledge Base
- Launch an Academy
Trainn is a customer education platform for SaaS companies that enables customer-facing teams to create product training content-such as videos and guides-and deliver it across knowledge bases, learning management systems (LMS), and in-app experiences to support onboarding, product adoption, and customer success at scale.
North Bethesda, Maryland 20852


