
Published on: 05 Dec , 2024
Customer Enablement ROI: A Data-Driven Approach to Measuring Impact
On this page
Most SaaS companies nail the basics: strong marketing funnels, efficient sales processes, happy customers. They can easily prove marketing ROI—traffic increases, conversions rise, revenue follows.
But customer enablement ROI? That's where things get complicated.
You're investing heavily in knowledge bases, training programs, and enablement teams. Yet when leadership asks about returns, quantifying impact feels impossible.
This is because enablement touches everything - retention, support costs, expansion revenue. This guide shows you exactly how to track and prove your enablement ROI.
The Basics of Calculating Customer Enablement ROI
While standard ROI might focus solely on financial returns, Customer Enablement ROI takes a more comprehensive view of the value created through your enablement initiatives. When you invest in customer enablement, and measure the ROI, you can expect to see:
- Whether customers use your enablement resources.
- What customers think about you.
- How your product usage has improved.
- Whether your customer-centric operations are more efficient.
- How well your business is growing as a whole.
Measuring these different dimensions gives you a 360-degree view of the value provided by your customer enablement efforts.
Why Measuring the ROI of Your Customer Enablement Programs is Critical?
Every investment expects a return. Financial returns are important for a business, yes. But, it shouldn’t be the only benefit you should expect from your customer enablement investment. When you measure your ROI, you can:
1. Make Data-driven Decisions
Solely relying on your gut feelings is not the best move when making any business investment decision. ROI measurements help you quantify the value of each customer enablement initiative.
This insight allows you to allocate resources more effectively, investing more in high-impact areas and optimizing underperforming programs.
2. Align Enablement with Business Objectives
Without clear ROI metrics, enablement programs risk becoming isolated initiatives disconnected from your core business goals.
Whether it's reducing support costs, increasing product adoption, or driving expansion revenue, measuring ROI helps you stay focused on initiatives that move the needle.
3. Shape Your Product Better
Product analytics from your customer enablement programs provide invaluable insights for your product development — support ticket trends highlight usability challenges, usage metrics pinpoint underutilized features, and customer journey analysis identifies friction points.
4. Better Personalize Your Efforts
ROI measurement helps you understand how different customer segments interact with your product and consume your enablement resources.
For example, this knowledge can help you tailor enablement content to specific use cases or personas, anticipate the needs of different user roles, and create targeted interventions for at-risk customers.
Calculating Customer Enablement ROI

Before measuring the returns, let’s break down the investments needed for your customer enablement program:
A. Initial Setup Costs
Setting up your customer enablement program for the first time can demand a huge initial investment both financially and the time taken to set it up. These costs mostly include:
1. Technology Infrastructure Investments:
Your enablement tech stack forms the foundation of your program. This includes:
- Knowledge base software
- Learning management system (LMS)
- Content creation suite (videos, guides)
- Customer success platforms
- Customer support platform
- In-app guidance tool
- Product analytics
Consider both the subscription costs and any add-ons to it.
2. Team Development
Building your enablement team involves hiring specialists and leaders across customer education, customer success, and customer support. Beyond salaries, factor in recruitment costs and initial time spent on training and onboarding.
3. Content Creation and Implementation
Your customer education team needs a lot of time to prepare an customer education strategy, develop the content in different formats, and implement it on different platforms, such as a knowledge base and LMS.
Your team needs to develop an enablement strategy which typically requires two to three months of focused planning. Then, they need to create a core content library, including product documentation, video tutorials, interactive learning modules, and assessment materials.
Integrating the content on platforms such as your LMS or Knowledge Base usually takes a week.
B. Ongoing Operational Costs
Once your program is established, maintaining its effectiveness requires consistent investment across these key areas.
1. Technology Maintenance
This includes managing platform subscription renewals, implementing necessary feature upgrades, or implementing new tools to keep pace with changing needs.
2. Content Updates
Significant time will be spent on maintaining your content’s quality and relevance. Product updates necessitate content revisions, while new features or use cases require fresh content creation. Video content can take especially longer to update than text-based content.
3. Team Operations
Beyond competitive salaries and benefits, you need to provide ongoing professional development opportunities to upskill your team.
Measuring and Weighing Customer Enablement Metrics
Once the calculation of investment costs is done, let’s look at how customer enablement impacts customers’ success, product usage, operations, and business growth.

How to measure the contribution of customer enablement?
1. Determine Who Your Enabled Customers Are
Enabled customers are the ones who consume your enablement resources. There are no set criteria to segment them, but ideally, your enabled customers should be active users who have accessed multiple enablement resources.
For example, the segmentation could look for customers who have:
- Completed 4-5 LMS courses
- Login to your product multiple times a week
- Have opened your nurturing email sequence
- Do not submit tickets for simple queries
2. Performance of Enabled Customers vs Non-enabled Customers
Once you know who your enabled customers are, the next step is to calculate the metrics that show the impact on different areas and weigh the performance of enabled customers vs non-enabled customers.
The goal is to prove that enabled customers ultimately yield better results while measuring the metrics.
A. Impact on Customers’ Success Metrics
These metrics allow you to see the impact on the customers’ success and their experience with your product.
1. Customer Satisfaction:
When customers have access to good enablement resources, they face fewer roadblocks and solve problems faster. For example, a customer who finds instant solutions through your knowledge base is more likely to report higher satisfaction than one who has to wait for support.
How to measure:
You can measure customer satisfaction through a Customer Satisfaction Score (CSAT) survey. Follow these steps to get your CSAT.
Step 1: Survey your customers asking them to rate their experience on a scale of 1-5.
Step 2: Note down the number of people who’ve voted for “4 or 5”. They are your Satisfied Respondents.
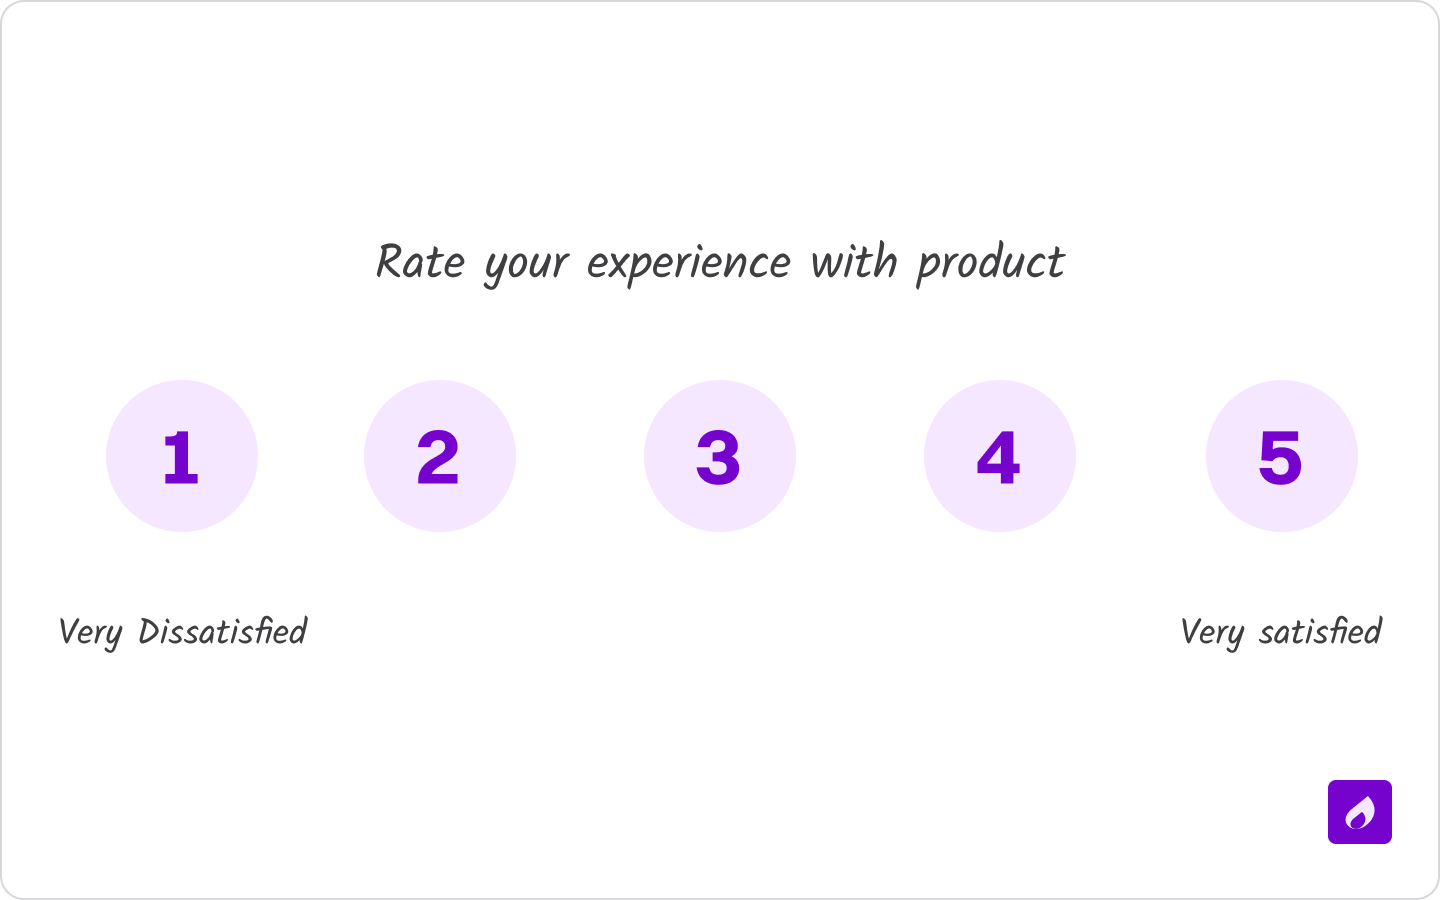
Step 3: Use this formula to get your CSAT -
(No. of Satisfied Respondents / Total No. of Respondents) X 100
2. Net Promoter Score (NPS)
NPS measures the likelihood of customers recommending your product to a peer. Customers who understand your product's full capabilities and can use it effectively become natural advocates. Customers who are very satisfied with your product are most likely to have a higher NPS.
How to measure:
NPS requires yet another survey similar to CSAT.
Step 1: Send a survey asking customers whether they would recommend your product to a friend on a scale from 1-10
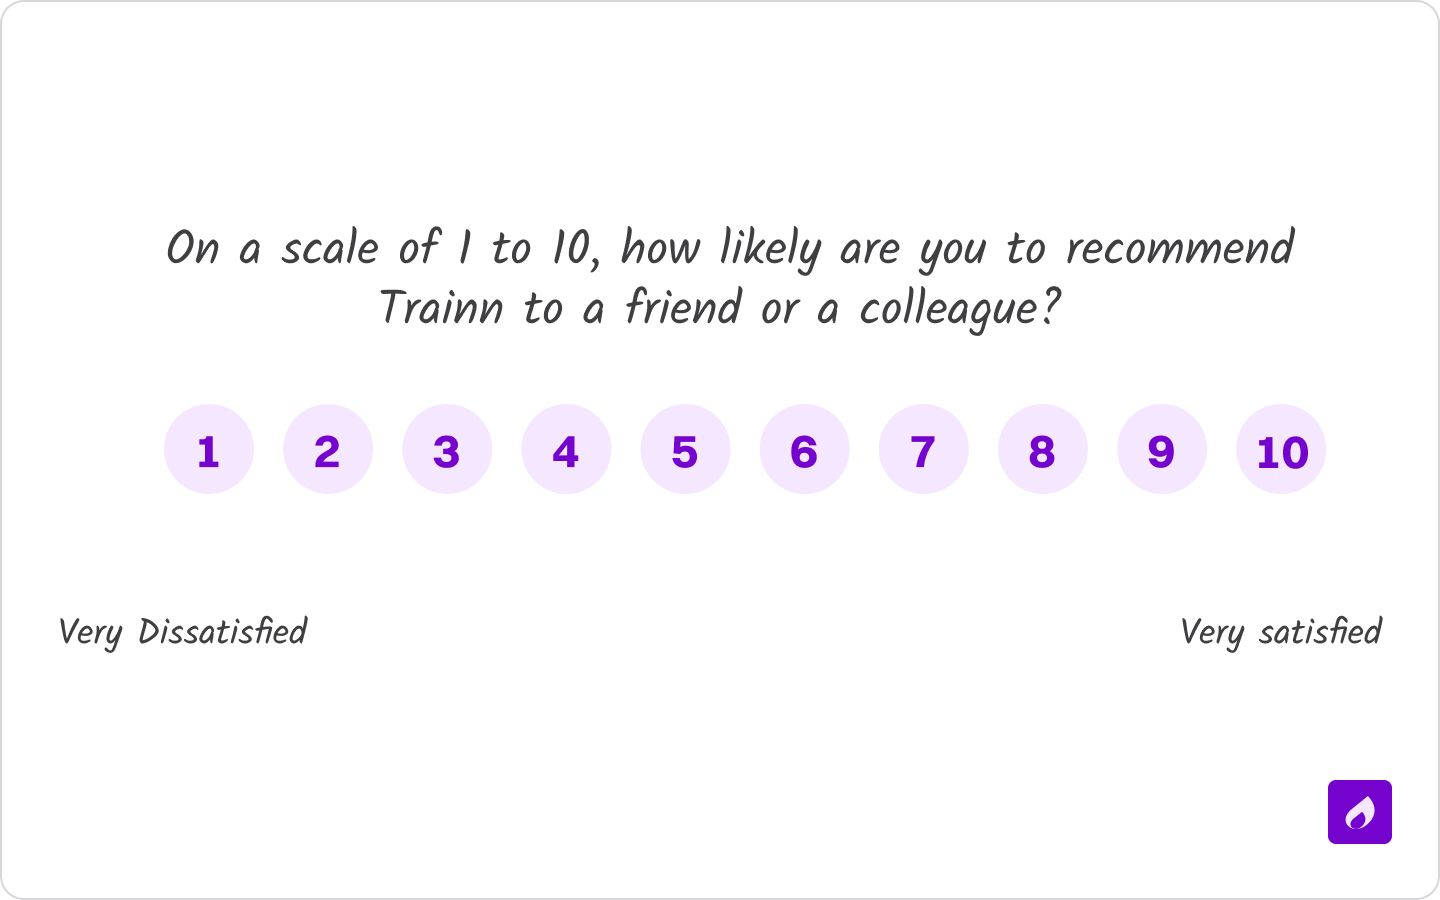
Step 2: Analyze the survey results
People who voted:
0 to 6 (Detractors) - are not likely to recommend your product
7 or 8 (Passives) - are satisfied but might not be actively recommending your product
9 or 10 (Promoters) - are more likely to recommend your product.
Step 3: Use this formula to find out NPS -
( Percentage of Promoters - Percentage of Detractors )
3. Time-to-value
Time-to-value, or time-to-first value measures the time it takes a customer to perform a task in your product and get the outcome successfully. For example, sending out an email campaign, publishing media content, exporting data, etc.
A good onboarding process helps customers get started with your product quickly, reducing the time it takes for them to achieve their desired outcome.
How to measure:
Measure the average time taken by customers to reach their first milestone after completing onboarding.
B. Impact on Product Usage
1. Feature Adoption
Without proper enablement, there is a possibility that customers might look over certain helpful features or not use them to their full potential. Training programs and feature tutorials can help you avoid this and encourage higher feature usage
How to measure:
( No. of active feature users / No. of active users ) X 100
Pro Tip: Monitor the feature adoption of newly released features after your enablement efforts for the feature have started.
2. Feature Stickiness
When customers can consistently get value from your product’s features, and they know when and how to use it, the feature can become essential to their product usage. This keeps them coming back to use the feature which can be monitored using feature stickiness.
How to measure:
You can measure feature stickiness for three levels of time intervals
The most common is:
Daily active users (DAU) divided by monthly active users (MAU)
You can also check the stickiness based on your product’s likely usage pattern:
Daily active users (DAU) divided by weekly active users (WAU)
Weekly active users (WAU) divided by monthly active users (MAU)
3. Product Adoption
Effective enablement programs help convert new users into regular users more efficiently. Through structured onboarding and continuous education, customers move from basic to advanced usage patterns, indicating successful product adoption.
How to measure:
( New Active Users / Total Signups ) X 100
4. User Flow Smoothness
Customer enablement makes product navigation intuitive and task completion efficient. When customers understand your product well, they complete tasks with fewer roadblocks.
How to measure:
1. Identify key user flows in your product
2. Track the completion rate of these flows:
( No. of users who completed the flow / No. of users who started the flow ) X 100
3. Measure the average time taken to complete each step in the flow:
( Sum of the time taken by all users / total no. of users in the step ) X 100
4. Track the drop-off rates of each step:
( No. of users who drop off at step X / total no. of users in step X ) X 100
C. Impact on Operations
1. Support Ticket Volume
When customers become more proficient with your product, they stop submitting tickets for trivial issues or feature clarifications. This reduces the number of repetitive tickets the support team has to handle, ensuring faster ticket resolution for other complex queries.
How to measure:
The support ticket volume will be available in your customer support tool. Check for a month-on-month reduction in the no. of support tickets received overall.
You can also check for a reduction in particular ticket categories that are considered repetitive like login-related tickets.
2. First-contact Resolution Rate
Enabled customers can provide more context to their queries. This helps your CSMs and support team to understand the issue better and share the most helpful resource within the first interaction.
For example, a customer having issues with exporting data can mention details such as the specific type of data, different filters applied, and the time frame of the data. A CSM can then share the knowledge base article that deals with the exact issue, fixing the customer’s problem in one go.
How to measure:
( No. of tickets solved on the first interaction / total no. of tickets ) X 100
3. Training Time And Costs
Through structured enablement programs, you can significantly reduce the cost of training new customers. This means you can onboard more customers without proportionally increasing training resources.
For example, if you previously needed one CSM for every 50 customers, good enablement resources might help one CSM to effectively support 200 customers. It also eliminates the need for conducting live sessions, saving time.
How to measure:
Step 1: Calculate the cost for training one customer using this formula:
( Total training costs / number of customers trained )
Step 2: Compare the training cost per customer every month to see how this number changes as you implement your customer enablement strategy
4. New Hire Onboarding
Strong enablement practices don't just help with customer onboarding - they also make the onboarding of your new customer-centric hire. This helps them understand the product better and get started with their work faster.
How to measure:
Compare the onboarding time for new team members with enablement resources vs Previous average onboarding time
D. Impact on Business Growth
1. Customer Retention
When customers are properly enabled, they continually find value in your product, leading to higher retention rates - increasing your Monthly Recurring Revenue and Annual Recurring Revenue
How to measure:
To calculate the customer retention rate, we need three metrics:
The number of Customers At the Start of the period (CAS)
The number of Customers At the End of the period (CAE)
The number of Customers you Gained in this period (CG)
Now, apply these metrics in the CRR formula:
CRR = ( (CAE-CG) / CAS ) X 100
2. Customer Churn
While retention shows who stays, churn rate reveals where your enablement might be falling short. By monitoring churn patterns, you can identify gaps in your enablement strategy and address them proactively.
How to measure:
(No. of customers lost / Total customers at the start of the period) X 100
Pro Tip: Conduct exit interviews focusing on the customer's enablement experience to identify potential gaps in your strategy.
3. Expansion Revenue
Enabled customers are more likely to upgrade or purchase additional features because they understand the full value proposition.
For instance, a customer who completes advanced feature training and regularly engages with enablement content is more likely to identify opportunities where premium features could solve their growing needs.
How to measure:
You can measure the expansion revenue using your upsell and cross-sell rates
Calculating Upsell Rate:
(No. of up-sells / No. of up-sell attempts) X 100
Calculating Cross-sell Rate:
(No. of customers who made additional purchases / No. of cross-sell attempts) X 100
4. Customer Lifetime Value
The impact of enablement on Customer Lifetime Value is significant as it influences how long a customer stays and how much they spend over time. Properly enabled customers tend to have higher CLV because they:
- Stay subscribed longer due to better product utilization
- Upgrade to higher tiers as they grow with your product
- Expand their usage across teams or departments
How to measure:
( Average revenue per customer / churn rate )
Best Practices to Increase Customer Enablement ROI

1. Data-Driven Resource Creation
The most effective enablement resources are created based on real user needs and behaviors, not assumptions. Start by analyzing your support tickets to identify common pain points and questions.
In one of our podcast episodes, Monica Sindwani suggested these steps:
Step 1: Collect your current or previous support tickets (say, a month).
Step 2: Categorize the tickets into different query buckets. For example, UI bugs, login issues, feature issues, etc.
Step 3: Create help articles, product documentation, and videos for these buckets addressing the pressing issues.
Step 4: Share these contents for support requests, email replies, and to your knowledge base.
2. Strategic Content Delivery
Timing is everything in content delivery. Use product usage triggers to identify when customers are ready for more advanced content. For example, If a customer frequently uses a basic feature, they might be ready for content about related advanced features.
This proactive approach ensures customers receive relevant information when they're most likely to apply it.
3. Community-Driven Learning
Enable peer-to-peer learning through user communities and forums. When customers share their experiences and solutions, they create valuable user-generated content that complements your official resources.
This not only reduces the burden on your teams but often provides real-world perspectives that resonate strongly with other users.
4. Use Automation for Data Management
One of the biggest challenges in measuring enablement ROI is gathering and analyzing data from multiple platforms.
Your enablement metrics are scattered across various tools - product analytics, LMS, support platforms, and CRM. Manually collecting and correlating this data is time-consuming and prone to errors.
Eric Mistry shared an amazing solution with us on our podcast. Using tools like Zapier, you can create automated workflows that pull data from different platforms into a single dashboard or spreadsheet.
This not only saves time but enables faster, more accurate ROI tracking. When all your enablement metrics are in one place, you can quickly spot trends and make data-driven improvements to your program.
Take Your Customer Enablement Efforts to the Next Level with Trainn
After understanding how to measure and improve your customer enablement ROI, you need the right platform to put these insights into action. Trainn brings together all the essential enablement tools you need in one unified platform.
With Trainn, you can:
- Create engaging product training videos, comprehensive interactive product documentation, and detailed help articles without design dependency.
- Build a centralized Knowledge Base for 24/7 self-service support.
- Launch a branded LMS with custom courses, quizzes, and certifications.
- Embed In-app Tutorials without coding to help customers when required.
- Track ROI with learner-level analytics showing how customers engage with your enablement resources.
If this all sounds too good to be true, you can try out Trainn for 14 days with all features unlocked. No credit card is required.
Reviewed by: Trainn Editorial Team
Ready to Trainn your customers?
- Create videos & guides
- Setup Knowledge Base
- Launch an Academy
Trainn is a customer education platform for SaaS companies that enables customer-facing teams to create product training content-such as videos and guides-and deliver it across knowledge bases, learning management systems (LMS), and in-app experiences to support onboarding, product adoption, and customer success at scale.
North Bethesda, Maryland 20852


