How to Create a Report on Zendesk Explore?
Created with Trainn AI
Here’s a step by step tutorial on how to create a report on Zendesk Explore:
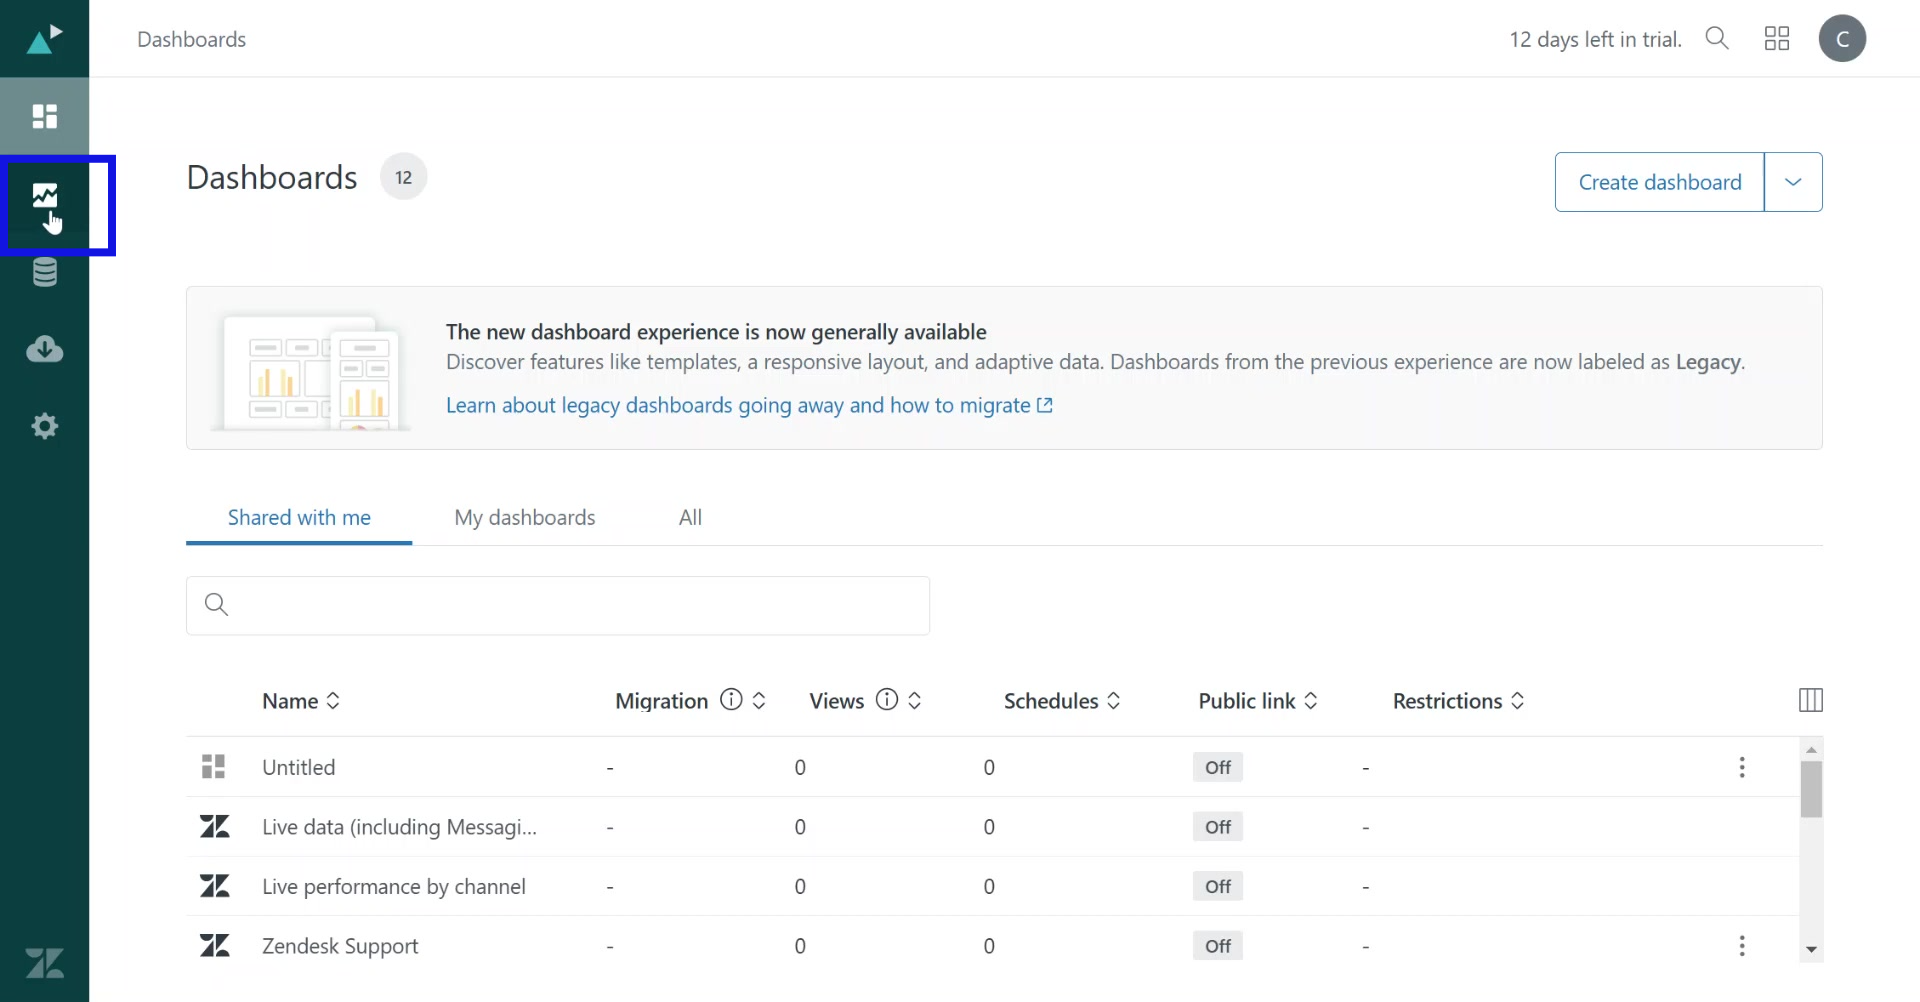
1. Go to Explore (Reporting), Click on the "Report icon" in the navigation bar.
2. Click on "New report" to start creating new report.

3. Select a Dataset that you want to measure.

4. Select a detailed dataset from the selected Dataset.

5. In the Dataset panel on the right, review the metrics included in the selected dataset.

6. Click on "Start report" to create a report.

7. Click on "New Report" at the top to add a title to the report.

8. In the Metrics section, Click on "Add" to choose a numerical value to measure.

9. In the Metrics panel that appears, select the metric that has to be measured.

10. Click on "Apply" after choosing the metrics.

11. The result of the selected metric is shown here.

12. In the Columns section, click on "Add" to select attributes for analysis.

13. In the Columns panel that appears, select the attributes to analyze.

14. Click on "Apply" after choosing attributes.

15. In the Rows section, click "Add" to select attributes for analysis.

16. In the Rows panel that appears, click to select attributes to analyze.

17. Click on "Apply" after choosing attributes.

18. Click on the "Visualization icon" on the right to select how the report must be presented.

19. Select how the data should be presented from the Visualization panel.

20. Click on the "Chart Configuration icon" to configure the charts further.

21. Set the display and appearance of the chart from the Chart configuration panel.

22. After editing the chart, click on "Save" at the top right to save the report.

Congratulations! You have successfully created a Report on Zendesk Explore.
Trainn is a customer education platform for SaaS companies that enables customer-facing teams to create product training content-such as videos and guides-and deliver it across knowledge bases, learning management systems (LMS), and in-app experiences to support onboarding, product adoption, and customer success at scale.
North Bethesda, Maryland 20852


